
Either a rebound or a breakout imminent on Hong Kong 50 Index
Hong Kong 50 Index is heading towards a line of 23855.5000. If this movement continues, the price of Hong Kong 50 Index could test 23855.5000 within the next 5 hours. But don’t be so quick to trade, it has tested this line numerous times in the past, so this movement could be short-lived and end […]

Huge bullish move on FTSE China A50 Index
FTSE China A50 Index has moved higher by 2.02% from 15,475.82 to 15,778.26 in the last 3 days.

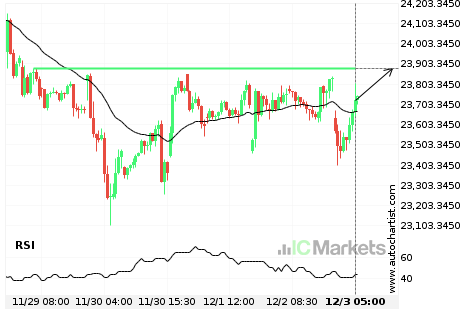
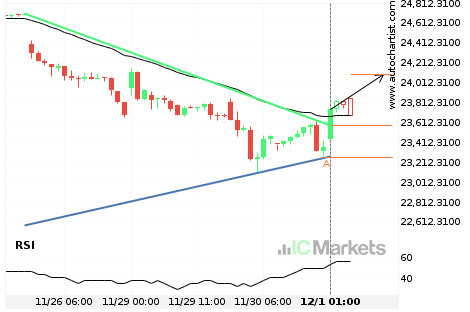
Huge bearish move on Hong Kong 50 Index
Hong Kong 50 Index has moved lower by 1.6% from 23,703.1 to 23,401.5 in the last 8 hours.

Huge bearish move on Hong Kong 50 Index
Hong Kong 50 Index has moved lower by 1.6% from 23,703.1 to 23,401.5 in the last 8 hours.
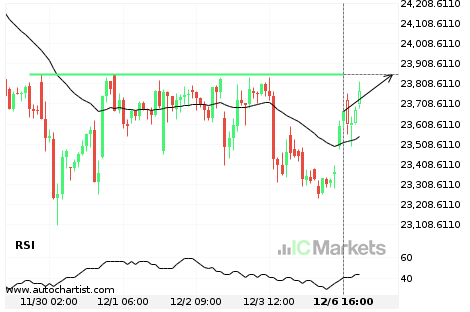
Should we expect a breakout or a rebound on Hong Kong 50 Index?
The movement of Hong Kong 50 Index towards 23880.5000 price line is yet another test of the line it reached numerous times in the past. We could expect this test to happen in the next 14 hours, but it is uncertain whether it will result in a breakout through this line, or simply rebound back […]
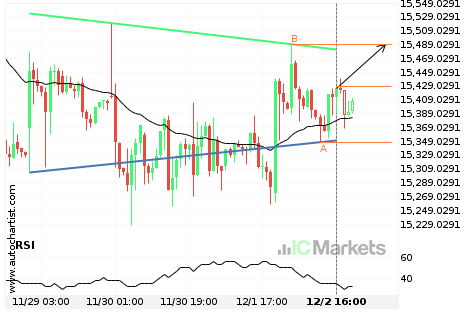
Either a rebound or a breakout imminent on FTSE China A50 Index
FTSE China A50 Index is heading towards the resistance line of a Inverse Head and Shoulders. If this movement continues, the price of FTSE China A50 Index could test 15489.4800 within the next 20 hours. It has tested this line numerous times in the past, so this movement could be short-lived and end up rebounding […]

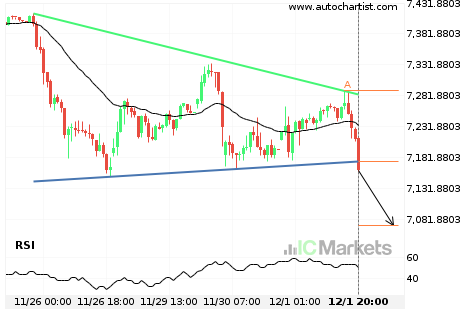
Australia 200 Index – support line breached
Australia 200 Index has broken through the support line of a Triangle technical chart pattern. Because we have seen it retrace from this line in the past, one should wait for confirmation of the breakout before taking any action. It has touched this line twice in the last 6 days and suggests a possible target […]
Possibility of big movement expected on Hong Kong 50 Index
Hong Kong 50 Index has broken through a resistance line of a Triangle and suggests a possible movement to 24091.3659 within the next 10 hours. It has tested this line in the past, so one should probably wait for a confirmation of this breakout before taking action. If the breakout doesn’t confirm, we could see […]